Read next
The latest news, updates and expert views for ambitious, high-achieving and purpose-driven homeowners and property entrepreneurs.


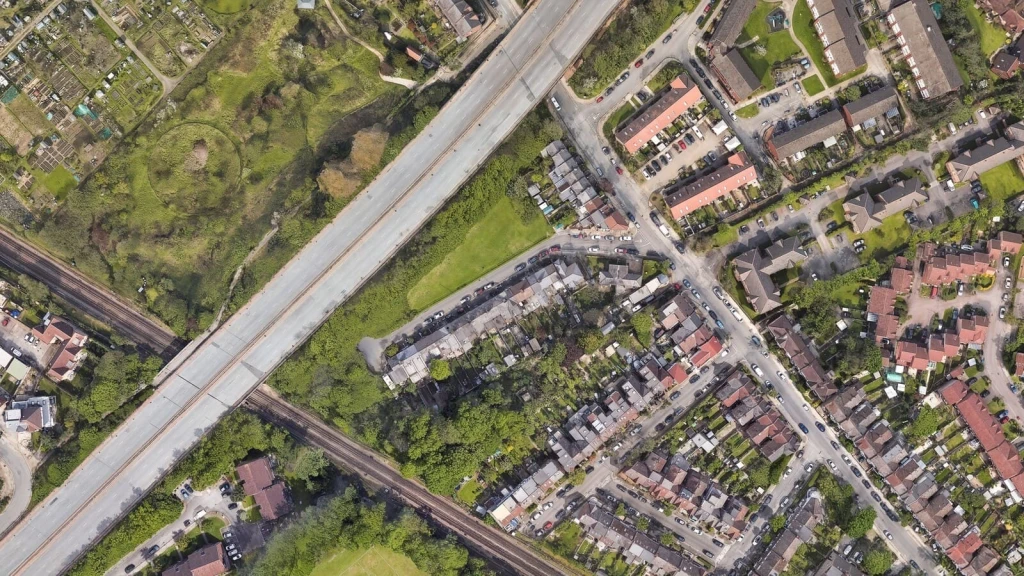
Imagine you are considering a nine-flat infill scheme in an outer London borough. Before committing to the purchase, you check the planning figures. Almost nine in ten applications are approved, and most minor applications are recorded as decided on time. The prospects look encouraging.
But those headlines include house extensions, loft conversions and other proposals facing different planning tests. They tell you little about how a scheme creating nine new homes might fare.
Look more closely at planning approval rates for housing and the picture changes. Urbanist Architecture's analysis of council returns found that more than one in four minor housing applications was refused in the year ending March 2026. Yet small schemes accounted for 87% of residential planning permissions granted that year.
The same problem runs through the figures on delay and appeals. A decision recorded as on time may follow months of agreed extensions. A council meeting the official quality threshold may still have a substantial proportion of its appealed decisions overturned.
To understand what these figures mean for small-site applicants, we examined planning decisions, housing supply and delivery results across England, and reviewed 58 recent appeal decisions in full. Our findings show where the headline measures fall short and what the NPPF 2026 means for preparing a strong application from the outset.
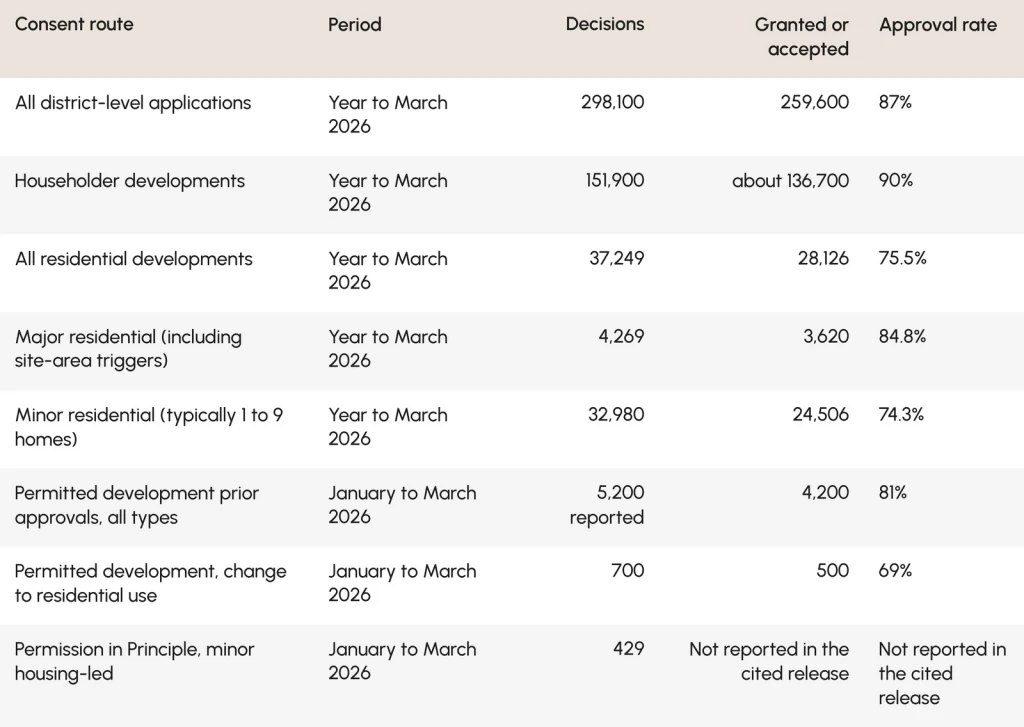
Planning refusal rates are substantially higher for minor housing applications than for major ones. In the year to March 2026, councils approved 84.8% of major housing applications and only 74.3% of minor ones, a gap that disappears the moment every application is bundled into a single national rate.
The January to March 2026 statistical release shows that householder applications made up 51% of all decisions in the year ending March 2026, with 90% granted. Commercial schemes were granted at a similar rate. New homes were not.
MHCLG's headline residential planning statistics show how many major and minor housing applications were granted, but not how many were decided in each category. Its PS2 council returns record both, and the gap is persistent. The April to June 2026 release and the matching returns show the same gap in residential planning application approval rates for the year to June 2026: 84.7% for major housing applications, against 74.4% for minor ones.
Nor is it a one-year blip. Urbanist Architecture analysis of MHCLG PS2 council returns across the three years measured by the 2025 Housing Delivery Test, April 2022 to March 2025, found:
England as a whole: 80.2% of 14,566 major housing applications approved, against 71.5% of 118,028 minor ones.
Council by council: small schemes were approved less often than large ones in four out of five councils with enough decisions to compare, with a median gap of 9 percentage points.
London: the median gap widened to 21 percentage points.
The weakest councils: 52 of 282 councils with at least 50 minor housing decisions approved fewer than 60% of them.
National planning permission approval rates tell a small developer little about the prospects of their own scheme. To understand the reasons planning permission can feel unpredictable, you need to consider the council’s record, the site’s constraints and how planning judgement is applied. The borough figures below show how much the local picture can differ: in parts of London, recorded approval rates for minor housing are close to 50%.
Prior approval looks generous until the extensions are taken out. Larger rear extensions made up 53% of prior approval applications in the first quarter of 2026, which flatters the 81% headline. Of the 700 applications to change buildings to residential use, only 500 (69%) got the go-ahead, and the following quarter's figure was 68%.
The longer record is starker. Over the 48 quarters since April 2014, where prior approval was actually required, councils granted 91,700 applications and refused 78,700: on Urbanist Architecture analysis of MHCLG Planning applications in England figures, a refusal rate of about 46%. That spans several rights and rule changes, so it is not today's Class MA rate, but it shows how differently prior approval behaves once a council engages with the merits.
Meanwhile, Permission in Principle is growing fast. Councils made 425 decisions on minor housing-led applications in the last quarter of 2025, up 171% on a year earlier, and 429 in the first quarter of 2026, up 137%.
The second quarter brought 551, up 79%. The route tests location, use and amount before technical details consent, and the surge suggests small promoters increasingly want to know whether a site is acceptable in principle before paying for a full design and technical package.
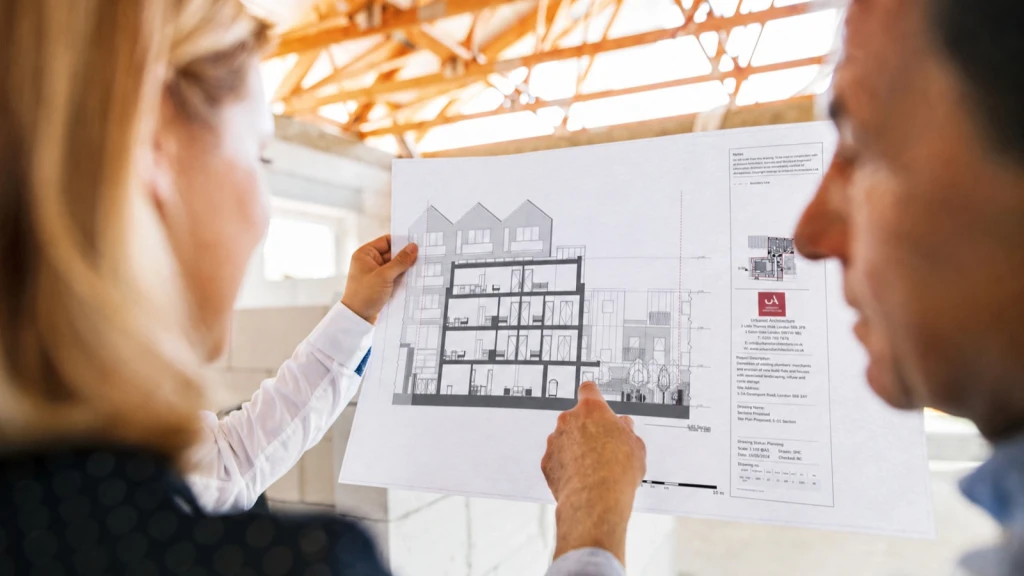
Three 2026 changes alter the risk calculation for every small scheme: a restructured national policy framework, a stricter appeal procedure and a mandatory national scheme of delegation. Together, they make the strength of the original application central to securing planning permission for small sites. A weak first submission is now much harder to rescue later.
Published on 17 August 2026, the NPPF 2026 substantially reorganised national planning policy, replacing the previous paragraph-based format with individually numbered policies and separating plan-making from decision-making.
The development plan remains the statutory starting point, but Annex A gives very limited weight to local policies that are materially inconsistent with the new national decision-making policies, subject to stated exceptions.
For small schemes and conversions, the most relevant policies are:
Policy S4: within settlements, development should be approved unless its benefits would be substantially outweighed by adverse effects assessed against the national decision-making policies.
Policy S5(1)(d) and S5(1)(j): outside settlements, the redevelopment of previously developed land is supported, and housing may be supported where it addresses an evidenced unmet need and is physically well related to an existing settlement. Under Annex D, a Housing Delivery Test result below 75% means evidenced unmet need is deemed to exist. S5 does not apply in the Green Belt.
Policy L2: substantial weight for making better use of vacant and underused buildings, including converting space above shops, and support for using the airspace above existing residential and commercial premises, including mansard roofs.
Policy HO6: plans should allocate at least 10% of their housing requirement on sites of no more than one hectare and a further 10% on sites of one to two and a half hectares, unless there are strong reasons why not. This is a plan-making policy, not a decision test.
Policies DM1 and DM2: major applications need a concise planning statement, while other proposals should need only the minimum information necessary to enable a decision, with local validation requirements kept proportionate.
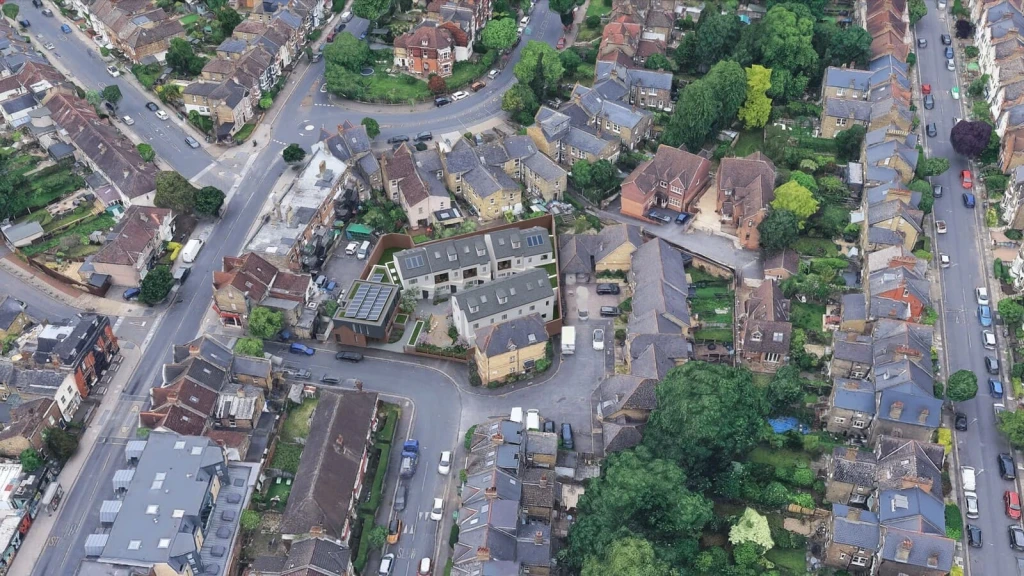
For applications submitted on or after 1 April 2026, SI 2026/122 introduced the Part 1 expedited written representations procedure. The Inspector decides the planning appeal on the application documents, the decision notice, the officer report and the appeal form.
There is no statement of case, and new evidence is admitted only in limited circumstances, such as a material change in policy or certain planning-obligation situations. The Inspectorate decides whether they apply.
It is too early to judge how Part 1 is working in practice. Of the 1,330 section 78 planning appeal decisions we identified between 18 August and 21 October 2026, only 42 had been decided under Part 1, and 12 of those were allowed in whole or in part.
The Planning Inspectorate's procedural guide retains Part 2, with a full statement of case, for non-determination, listed building consent and discontinuance appeals. Do not mistake it for a back door.
Part 2 does not provide a general opportunity to introduce technical evidence missing from the application, and the guide, updated on 14 October 2026, confines the exceptions to narrow cases such as certain newly executed planning obligations.
The message for applicants is blunt. In most cases, an evidential gap in the application is now a gap the appeal cannot fill. The realistic cure is a revised application and a restarted clock.
From 31 October 2026, SI 2026/854 requires officer determination of Schedule 1 applications, including householder and minor commercial applications, prior approvals, lawful development certificates and Permission in Principle. Its minor residential category covers one to nine dwellings, with only development incidental to them, on sites below 0.5 hectares. The statutory classification, not the unit count alone, decides the route.
Schedule 2 applications, including major development, retrospective applications and listed building consent, may reach committee only through joint referral by a nominated member and a nominated officer on the specified significance grounds. A small scheme connected with listed building consent can fall within Schedule 2, and own-interest applications have separate referral arrangements.
Delegation already covered 97% of decisions in the second quarter of 2026, so the change matters most for the contentious infill and conversion schemes that ward councillors used to call in. For eligible Schedule 1 applications, planning permission without planning committees becomes mandatory rather than a matter of local discretion.
Delegation changes who decides, not how the case is assessed. Consultation, neighbour representations and the officer's power to refuse all remain.
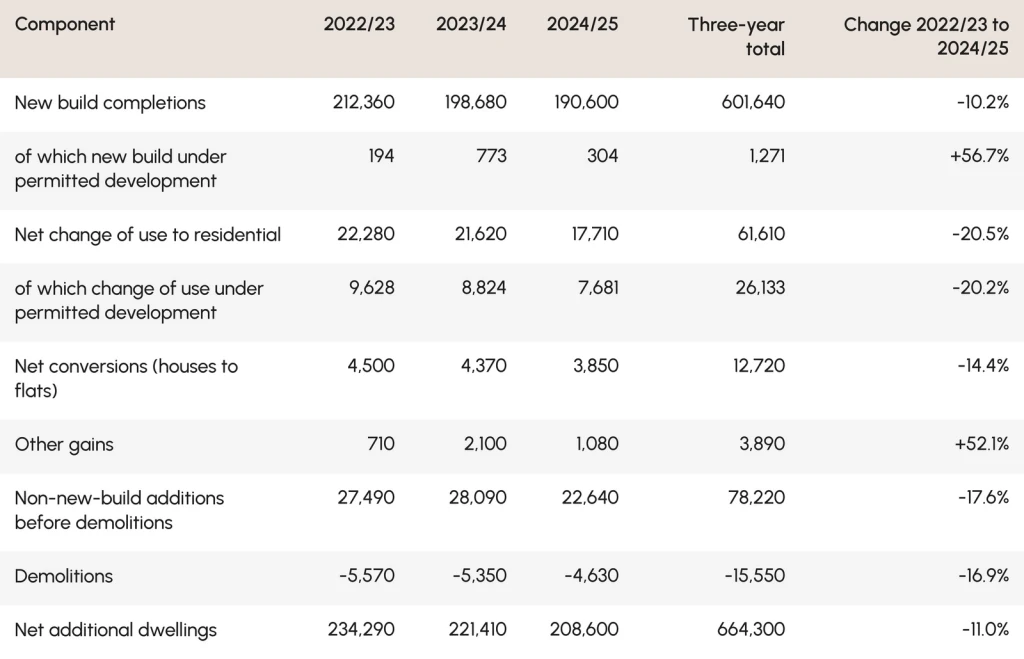
Homes created from existing buildings are a material part of England's housing supply, and they are shrinking faster than new build.
Three findings stand out.
First, non-new-build supply is contracting faster than new build. Additions from changes of use, conversions and other gains fell by 17.6% over two years, against 10.2% for new build. Change of use alone fell by 20.5%, roughly twice the new build rate.
Across the three years measured by the latest Housing Delivery Test, these routes added 78,220 homes before demolitions, equal to 11.8% of the 664,300 net additions. That is a comparison with total net supply rather than a market share, because MHCLG does not attribute demolitions to particular routes.
Second, most recorded change of use sits outside the permitted development figures. Urbanist Architecture analysis of MHCLG net additional dwellings data shows that permitted development delivered 26,133 of the 61,610 change of use homes, or 42.4%. Much of the remaining 57.6% is likely to reflect full planning permission, although the aggregate returns cannot confirm every home's consent history.
Within permitted development, the mix is shifting. Office to residential completions fell by 35.3%, from 7,963 to 5,154, while the commercial, business and service use right associated with Class MA more than doubled, from 454 to 1,048.
Third, new build under permitted development is negligible: 304 homes in 2024/25 across the whole of England, of which identified upward extensions and demolition-and-rebuild schemes accounted for only a few dozen.
Every new home created through Class MA permitted development must meet the nationally described space standards under article 3(9A). This means at least 37 sqm for a one-person home with a shower room, 39 sqm with a bathroom and 50 sqm for a one-bedroom, two-person flat on one level.
However, unlike full planning applications, Class MA prior approval does not require a particular mix of dwelling sizes or housing tenures, including affordable housing. Councils cannot impose local housing mix policies through this route. They must instead assess the matters specified in the permitted development regulations, including adequate natural light in all habitable rooms.
This distinction matters when converting offices into homes under permitted development rights. Deep commercial floorplates, single-aspect rooms facing party walls and bedrooms beside plant or servicing areas can make compliance difficult. Class MA permits the change of use but does not authorise external building works, so new windows, extensions and other alterations need separate permission where required.
A full planning application can address these limitations through lightwells, altered windows, rear extensions or mansard roofs. Policy L2 of the NPPF 2026 gives substantial weight to the benefits of making better use of underused buildings, achieving higher housing density and creating additional homes above existing premises, subject to the relevant planning considerations.
In our work on infill developments and building conversions, we consider the planning route alongside the alterations needed. For suitable buildings, we assess whether Class MA prior approval can establish residential use while a separate full planning application seeks the alterations needed for a better layout. Both routes can be pursued together where their permissions and implementation requirements are compatible.
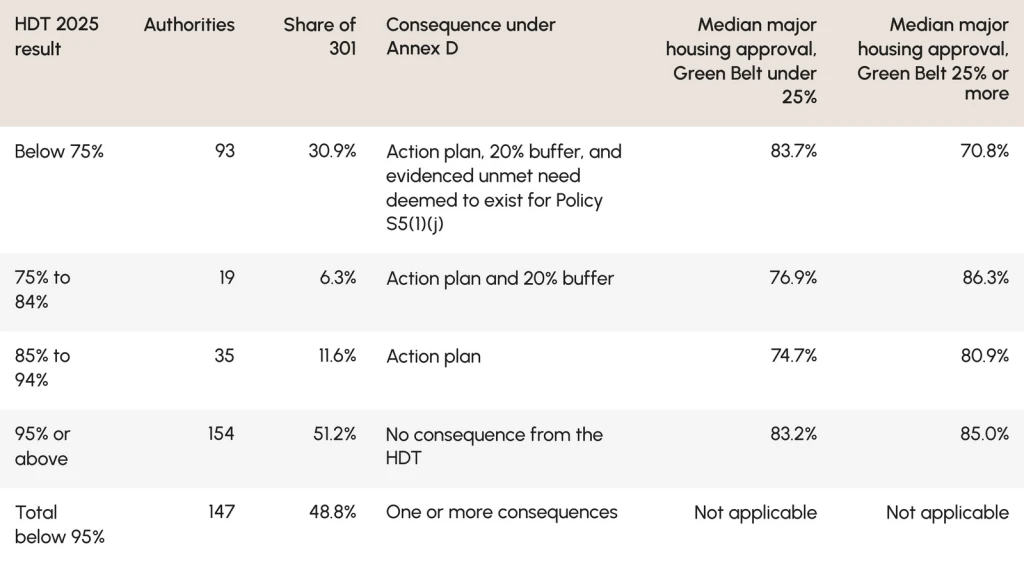
A low Housing Delivery Test score does not mean the same thing everywhere. The 2025 measurement, published on 17 August 2026, produced 301 numerical results. Urbanist Architecture analysis of MHCLG PS2 council returns, those results and official Green Belt statistics compares each council's delivery result with its major and minor housing approval rates over the same three years.
The comparison shows two contrasting patterns among councils falling short on housing delivery. Some also have low approval rates; others approve a high proportion of major housing applications despite the delivery shortfall. We use these groupings to distinguish the patterns, without assuming that the figures explain individual refusals or why permitted homes remain unbuilt.
In districts with substantial Green Belt coverage, low housing delivery is often accompanied by lower planning approval rates. Among councils where at least 25% of land is Green Belt, those with Housing Delivery Test results below 75% approved a median of 70.8% of major housing applications.
By comparison, councils meeting at least 95% of their housing targets achieved a median approval rate of 85.0%. Minor housing schemes faced greater difficulties, with a median approval rate of just 68.5% in the under-delivering group.
Individual council planning approval rates show how this pattern varies locally. Over the three years, Mole Valley (HDT 72%, 76% Green Belt) approved 14 of 36 major housing applications and 53% of minor ones. Epping Forest (66%, 91% Green Belt) approved 18 of 38 majors and 50% of minors. St Albans (46%, 82% Green Belt) approved 37 of 60 majors.
We cross-referenced these findings with the ten councils designated under section 62A because too many of their major decisions were overturned at appeal. Five of the ten also scored below 75%: Hertsmere (26%), Dacorum (52%), South Tyneside (53%), Lewes (60%) and Epping Forest (66%).
Designation lets major applications go directly to the Planning Inspectorate. It offers nothing to proposals in the non-major category, which is where small schemes sit.
In these places the HDT score is a policy lever. Outside settlements, on land that is not Green Belt, a result below 75% satisfies the unmet need element of S5(1)(j), although the other S5 tests still have to be met.

In several large cities, the low score sits alongside high approval of large schemes. Over the same three years, Wolverhampton (HDT 59%) approved 46 of 48 major housing applications, Bristol (41%) 92 of 102, Birmingham (57%) 124 of 145 and Sheffield (58%) 93 of 110.
None is designated for poor decision quality. In London, London Councils said in 2025 that boroughs had granted permission for almost 300,000 homes that were yet to be built.
My reading is that, in these cities, what happens after consent deserves far more scrutiny than refusal risk. That distinction also runs through our analysis of planning reform and housing delivery: stronger policy support does not remove the infrastructure, viability and finance constraints that can prevent approved homes being built.
The gap in residential planning permission success rates between small and large schemes is particularly stark in London. In the 14 boroughs that scored below 75% and had enough decisions to compare, the median approval rate was 89.6% for major housing and 50.4% for minor housing.
These are medians across the 14 boroughs, calculated separately for major and minor housing applications. The minor housing median of 50.4% shows how low recorded approval rates were in this group; it does not mean that an individual proposal has a roughly even chance of approval.
The official returns for April 2022 to March 2025 show the pattern borough by borough:
Barking and Dagenham (HDT 58%): 28 of 29 major housing applications approved, but 42% of 300 minor ones.
Brent (56%): all 28 majors approved, against 47% of 442 minor schemes.
Tower Hamlets (47%): 38 of 42 majors approved, against 48% of 190 minor schemes.
Havering (40%): 40% of 585 minor housing applications approved.
Some of those refusals will have been justified on their merits. But when a borough misses its housing delivery target while refusing more than half of the small housing schemes submitted, applicants deserve an explanation. The official performance tables do not ask for one.
The draft London Plan 2026 may help shift that picture over time, with proposals for suburban intensification and small-site design. Those proposals are still emerging, however. They should inform the longer-term view without being confused with the adopted policies governing applications today.
For applicants in these boroughs, the immediate argument is that small sites can deliver homes quickly where delivery is falling short. Low-rise schemes may also avoid some of the constraints associated with tall blocks. Whether higher-risk building requirements apply depends on the building and the proposed works, rather than dwelling numbers alone. But the refusal record makes one thing clear: the need for more homes will not carry a scheme on its own. Design, access and amenity still have to withstand scrutiny.
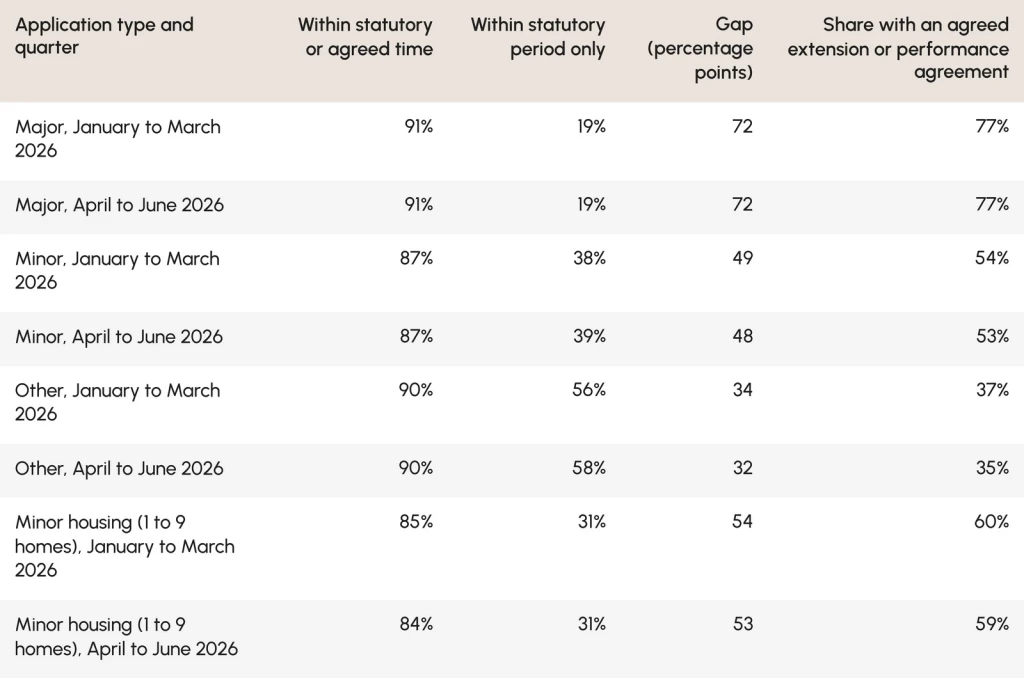
Councils report that almost nine in ten minor applications are decided on time. Fewer than four in ten are decided within the eight weeks the law sets. The difference is the extension of time, and it is the applicant who agrees to it.
MHCLG counts a decision as on time if it is made within the statutory period or a later date agreed with the applicant. The speed thresholds for designation, 70% of non-major decisions over two years, use the same measure. No council is currently designated for non-major speed; Bristol, the last, was de-designated on 27 January 2026.
Minor housing fares worse than the minor category as a whole. In the second quarter of 2026, only 31% of minor housing applications were decided within eight weeks, while 59% involved an agreed extension or performance agreement. The official figure still records 84% as on time.
The pressure is not easing: councils held 114,000 applications on hand at the end of June 2026, and research by the Home Builders Federation and Paragon Bank estimates a shortfall of 2,660 planners across England and Wales.
Decisions also cluster on the deadline itself. Our earlier study of planning permission timelines in London found that the median householder decision in 2025 took exactly 56 days.
For a small developer, delay is not a statistic. It is interest. Taking an illustrative 16-week overrun, about 3.7 months, and the Q2 2026 Bridging Trends average monthly rate of 0.81%, published by MT Finance on 25 August 2026, the cost according to Urbanist Architecture estimates is:
£250,000 bridging facility: about £7,493 in additional interest.
£500,000 facility: £14,985.
£1 million facility: £29,970.
A London household renting while it waits, at the ONS average London rent of £2,338 a month for September 2026: £8,651.
The scenarios assume a constant loan balance and simple interest. They exclude arrangement, exit and other charges, and compounding where it applies, so real costs on a live facility are likely to be higher.
For a minor scheme where the officer has confirmed that the principle is supported and the outstanding work is defined, I would agree to a short extension tied to a named task, such as agreeing conditions or completing a unilateral undertaking, and a firm date.
Where the request is open-ended, the officer will not state a position and the file already contains what a decision needs, a non-determination appeal deserves serious consideration, weighed against its cost and likely timetable.
The trade-off is control: an appeal hands the decision to an Inspector, follows Part 2 subject to the same evidence limits, and should be pursued on its merits rather than as a bargaining tactic. The right to appeal arises only once the statutory or agreed period has expired, so every extension you sign postpones that option as well as the decision.
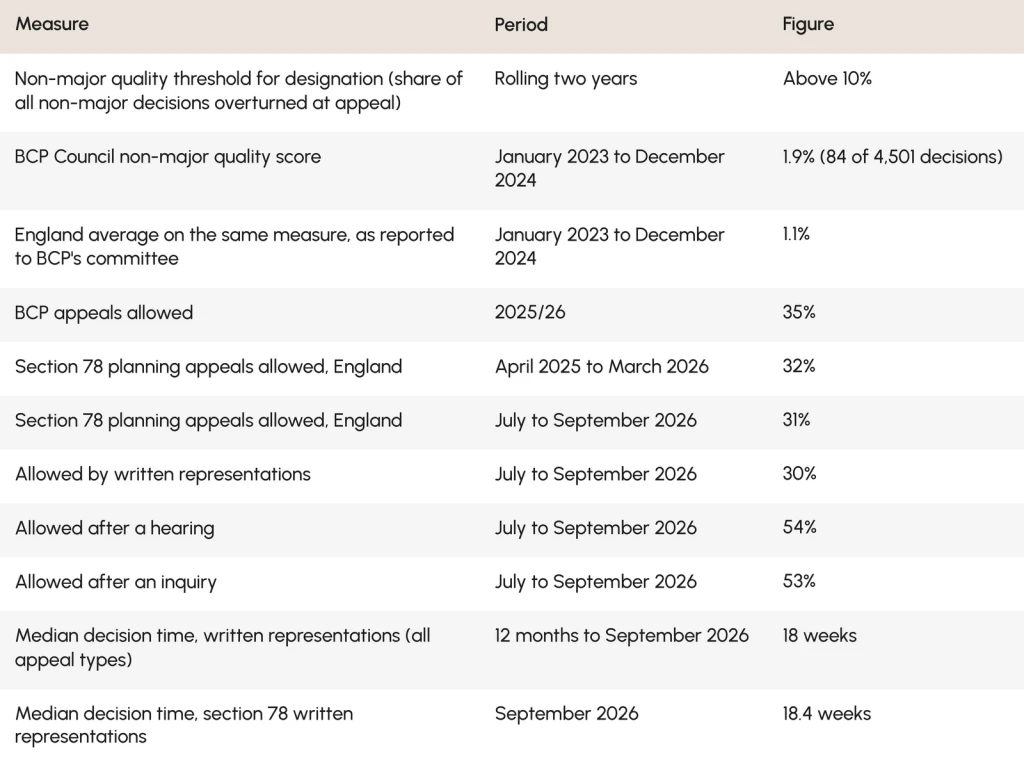
The official measure of decision quality and an applicant's chance of winning an appeal answer different questions, and the difference lies in the denominator.
MHCLG's Table P154 expresses non-major decisions overturned at appeal as a share of all non-major decisions, granted and refused. A council is eligible for designation only if the result exceeds 10%. The Planning Inspectorate's allow rate, by contrast, measures outcomes among appeals actually decided.
The arithmetic is unforgiving. A council that grants 88% of its non-major applications refuses 12%. Even if every one of those refusals went to appeal, Inspectors would have to allow more than four in five of them before overturned decisions passed 10% of all decisions.
In practice most refusals are never appealed, so the real bar is higher still. The threshold is reachable for a council with a low approval rate and heavy appeal caseload, but it measures something far removed from an applicant's prospects.
Bournemouth, Christchurch and Poole Council shows the two measures side by side. Its official non-major score for 2023 and 2024 was 1.9%, comfortably inside the threshold, while its own committee report records that 35% of appeals against its decisions in 2025/26 were allowed. The periods differ, but the contrast shows how differently the two measures are built.
No council is currently designated for non-major quality. For an applicant weighing an appeal, the figure that matters is the allow rate for comparable appeals, not the council's quality score.
The higher allow rates at hearings and inquiries are not a reason to ask for one: the Inspectorate chooses the procedure, and those cases differ in scale and complexity.

Inspectors allowed about one in three of the small-scheme appeals in our sample, and more than half of the appeals they dismissed involved evidence, details or legal mechanisms the appellant had not supplied. They describe the decisions we reviewed, not a national success rate, but they point firmly in one direction.
We reviewed 58 section 78 appeal decisions on schemes creating one to nine homes, sampled from all such decisions issued from 18 August to 14 October 2026 and covering 48 local planning authorities. They are among the first made under the NPPF 2026, which 51 of them applied. We assessed each Inspector's reasons against the same predefined list of planning issues and recorded the decision-letter paragraphs supporting each finding.
Of the 58 appeals, 19 were allowed (33%). Across the 419 screened decisions from which the sample was drawn, the allow rate was 29%. We deliberately included a higher proportion of conversions in the sample and did not apply statistical weights to correct for that difference. The sample's overall approval rate therefore cannot be treated as a national figure.
Conversions and changes of use: 10 of 23 allowed (43%).
New build schemes: 9 of 35 allowed (26%).
Prior approval appeals for new homes: 7 of 13 allowed.
Appeals involving sites in the Green Belt: 1 of 7 allowed.
These figures overlap with the two main categories above. All 13 prior approval appeals are included in conversions and changes of use; the seven Green Belt appeals include both new build and conversion schemes.
Within our sample, these were the issues Inspectors most often found against the appellant in the 39 dismissed appeals:
Character and appearance: 21 decisions (54%).
Location, accessibility or settlement strategy: 20 (51%).
Ecology, protected habitats or biodiversity net gain: 9 (23%).
Heritage: 7 (18%).
Prior approval matters or eligibility under the permitted development rules: 6 (15%).
Living conditions of future occupiers: 6 (15%).
Most dismissed appeals failed on more than one issue: inspectors found against the appellant on at least two issues in 31 of the 39 cases. Outside settlements and in the Green Belt, location was a recurring obstacle, attracting an unfavourable finding in 20 of the 25 dismissed appeals. Within settlements, character and appearance was the most common stumbling block.
Housing need rarely tipped the balance. Inspectors gave weight to housing supply or unmet need in 41 of the 58 decisions, but treated it as decisive in only seven. Several appeals outside settlements still failed because the site was not physically well related to a settlement.
The distinction matters: a shortage of homes can strengthen the planning case, but it cannot satisfy a separate requirement about where those homes should go. Our analysis of planning appeal decisions under the NPPF 2026 examines how the policy route, site-specific harm and legally secured mitigation shape the outcome.
In 22 of the 39 dismissed appeals (56%), we identified missing or inadequate evidence, details or legal mechanisms. In some cases, the Inspector could not reach a favourable conclusion without further technical information.
In others, a proposed commitment carried no weight because the appellant had not secured it. These shortcomings do not establish that supplying the missing material would have changed every outcome.
The missing evidence was often straightforward. Examples included noise assessments for flats above commercial premises, protected species surveys, biodiversity calculations, flood risk assessments, evacuation plans and structural calculations for barn conversions.
Other cases lacked marketing evidence to justify the loss of employment space or legal agreements securing habitat mitigation. Conversions were particularly affected, with evidence gaps identified in 10 of the 13 dismissed appeals.
In two decisions, Inspectors set aside amended plans or new reports because they would have changed the scheme being judged. A third declined to secure a proposed access change by condition, while late material was accepted in several others. Most sampled applications predate Part 1, so these decisions reflect the more forgiving regime. Under Part 1, exclusion is the normal position.
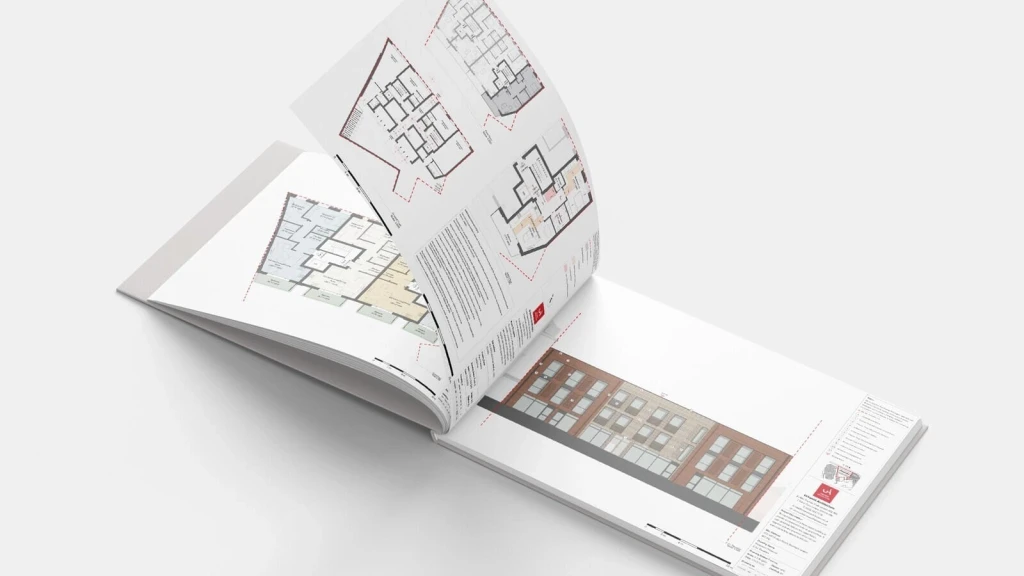
Our findings reinforce the importance of resolving likely refusal grounds before submission, particularly as the 2026 appeal reforms restrict the opportunity to supply missing evidence later.
Address refusal risks before fixing the design. As residential architects, we identify likely refusal grounds before the design is fixed and include the evidence needed to address them in the original application, applying the same rigour to projects large and small. Commission supporting reports early enough for their findings to influence the proposal.
Give every extension a purpose and a deadline. Establish what remains outstanding, who will resolve it and when a decision can reasonably follow. If the application is complete but progress has stalled, weigh the cost and likely timetable of a non-determination appeal before agreeing to another extension.
Confirm how the application will be decided. Check whether the proposal falls within mandatory officer delegation or could reach committee, particularly where housing is combined with commercial uses or listed building consent. Base the strategy on the applicable route and planning merits, rather than an assumed opportunity for councillor intervention.
Match the consent route to the uncertainty. Where eligible, consider Permission in Principle to establish whether the location, use and amount of development are acceptable before funding detailed design. For conversions, assess whether compatible prior approval and full applications could establish residential use while seeking building alterations needed for a better scheme.
The key point is timing. Evidence commissioned before submission can shape the design and sit on the record any Inspector will read. Evidence commissioned after a refusal will normally have to support a new application instead.

My principal concern is how the headline approval, speed and appeal-quality figures are used. Each measures a different aspect of council performance, and none, on its own, gives a small housing applicant a reliable account of the risks examined here.
None of this requires bad faith. It only requires measures designed to manage council performance to be read as a guide to an applicant's prospects, which is exactly how they are quoted.
Strip away householder extensions, agreed extensions of time and the all-decisions denominator, and a very different system appears: one that refuses small housing schemes more often than major ones, decides most of them outside the statutory period and, on the official measures, currently designates no council at all for non-major speed or quality.
National policy now says, in terms, that small sites matter. Policy HO6 asks plans to allocate at least 10% of housing on sites of no more than one hectare, and Policy L2 gives substantial weight to reuse.
Yet the reforms add policy support with one hand and remove second chances with the other. Part 1 shuts out most new material at appeal, and mandatory delegation removes the committee as a route around a cautious officer. The small applicant who could once repair a weak case later now has to get it right the first time.
There is also a tension the reforms have not resolved. Policies DM1 and DM2 tell councils to ask non-major applicants for only the minimum information necessary, yet the appeal decisions show what happens when a file is too thin. Proportionate must now mean targeted, not minimal: concentrate the evidence on the issues that will decide the case.
I would also resist the instinct to treat a sub-75% HDT score as a lever that works the same way everywhere. In a consent-constrained district, it changes the policy position and should be pressed hard against the S5 tests. Where large permissions are not delivering, the stronger argument is that this scheme can be built while larger consents wait.
London deserves the most attention. A borough's strong record on large housing applications says almost nothing about how it treats small ones, so the case has to be won on design and amenity evidence.

At Urbanist Architecture, we help landowners, developers and homeowners assess, design and secure planning permission for small to medium scale residential developments.
Our research shows why small-site applicants need more than reassuring national approval figures. Refusal rates are higher, delays are often understated and the 2026 reforms leave less opportunity to address missing evidence at appeal. Before buying a site or committing to a design, the priority is to understand what could prevent permission and how the application can address it.
An architectural feasibility assessment is where we start. For clients developing small sites or adapting existing buildings, we assess planning policy, development capacity, access and neighbouring amenity. We use those findings to recommend a consent route, develop the design and coordinate the supporting evidence.
Where an application has already been refused or a decision is overdue, we can advise whether a planning appeal or a revised application offers the stronger way forward.
Urbanist Architecture undertook this research to examine how small housing schemes fare in England's planning system. We compared approval rates for small and large housing applications, examined decision times and reviewed appeal outcomes. The council comparisons show differences in recorded outcomes; they do not establish why an individual council granted or refused permission.
Based on evidence checked in October 2026, the findings indicate where small-site applicants face the greatest risk of refusal, delay and an unsuccessful appeal. They do not predict the outcome of any particular application, site or appeal.
Official statistics remain attributable to their original publishers. Derived calculations should be cited as Urbanist Architecture analysis of the named source, with the relevant period and methodology. The bridging-finance and rental scenarios are Urbanist Architecture estimates.
PRESS ENQUIRIES: media@urbanistarchitecture.co.uk
We examined official figures on planning decisions, housing supply, the Housing Delivery Test and Green Belt coverage alongside Planning Inspectorate statistics. We also assessed a separate sample of individual appeal decisions. Each finding identifies the period it covers. The sources cannot be used to trace individual planning applications through to completed homes.
National planning figures, including residential planning approval rates, speed of decision and prior approval outcomes, were drawn from MHCLG's Planning applications in England statistical releases for January to March 2026 and April to June 2026, with detailed calculations from the accompanying PS2 returns. Decisions, grants and decision times for major and minor housing were calculated from MHCLG's PS2 district-level open data, published with the April to June 2026 statistics, by summing each council's quarterly returns.
Supply components were taken from MHCLG's net additional dwellings releases, using the latest revised figure for each year from 2022/23 to 2024/25. Permitted development figures are those recorded by MHCLG; the remainder of change of use is described as outside the recorded permitted development figures, not as a verified count of full planning permissions.
Housing Delivery Test results from the 2025 measurement, published on 17 August 2026, were matched by ONS code to each council's PS2 returns for April 2022 to March 2025, the same three years the test measures, and to the share of its land designated as Green Belt at 31 March 2025.
The headline comparison covers 229 councils outside London with at least 20 major housing decisions and returns for at least ten of twelve quarters. At least 25% Green Belt coverage defines the heavily Green Belt group. London is analysed separately. Medians describe a typical council in each group, rather than a pooled approval rate. The groupings identify patterns to investigate, not causal explanations of delivery failure.
The research appendix records the appeal decisions considered, the screening results, exclusions and reasons, and our assessment of the sampled decisions with supporting paragraph references. It includes the sampling script and random seed so that the selection can be reproduced, together with the 42 Part 1 decisions identified up to 21 October 2026. The accompanying workbook reproduces the national PS2 calculations and council comparisons from the PS2, Housing Delivery Test and Green Belt records. The appendix is available on request at the press address above.
Delay costs were modelled as simple interest at the average monthly bridging rate reported in Bridging Trends for Q2 2026, and as rent at the ONS average London private rent for September 2026, over an illustrative 16-week period. They are scenarios, not quotations or client costs.
Figures quoted directly from official sources include national decision and approval totals, speed of decision, Housing Delivery Test results, net additional dwellings, Planning Inspectorate appeal rates and section 62A designations.
Urbanist Architecture calculated the approval comparisons, minor housing decision times, council medians and housing supply figures from the official sources named above. We separately assessed individual appeal decision letters identified through the Planning Inspectorate’s casework database. The finance and rental scenarios are our estimates, calculated using the cited market rates and ONS rent figures.
The figures do not reveal how many proposals were revised or abandoned before a decision, nor can permissions be linked to homes subsequently completed. The national statistics predate the NPPF 2026, and most applications underlying the sampled appeals predate the Part 1 procedure. The findings therefore describe the starting position and early appeal decisions, rather than establishing the reforms' effects. The appeal sample excludes refusals that were never appealed and cannot be generalised nationally. Finally, the council groupings identify patterns, not the causes of refusals or unbuilt planning permissions.
We look forward to learning how we can help you. Simply fill in the form below and someone on our team will respond to you at the earliest opportunity.
The latest news, updates and expert views for ambitious, high-achieving and purpose-driven homeowners and property entrepreneurs.

We specialise in crafting creative design and planning strategies to unlock the hidden potential of developments, secure planning permission and deliver imaginative projects on tricky sites
Write us a message